
Neighbourhood Analytics
The ANIMUS Hub brings together every signal from the Neighbourhood App and integrations in one place, makes it visible and turns it into concrete recommendations. You always see what is happening in your neighbourhood and know what to do next.
200+ neighbourhoods since 2014
From measuring to managing
Numbers alone don't create impact. Neighbourhood Analytics takes you from observation to decision in three steps.
All KPIs from operations, community and services come together in one place, in real time and with no manual prep.
Neighbourhood Analytics recognises patterns, shows trends over time and surfaces where action is needed.
Data becomes concrete recommended actions. You decide on facts instead of gut feeling and steer your neighbourhood across the entire lifecycle.
Operations
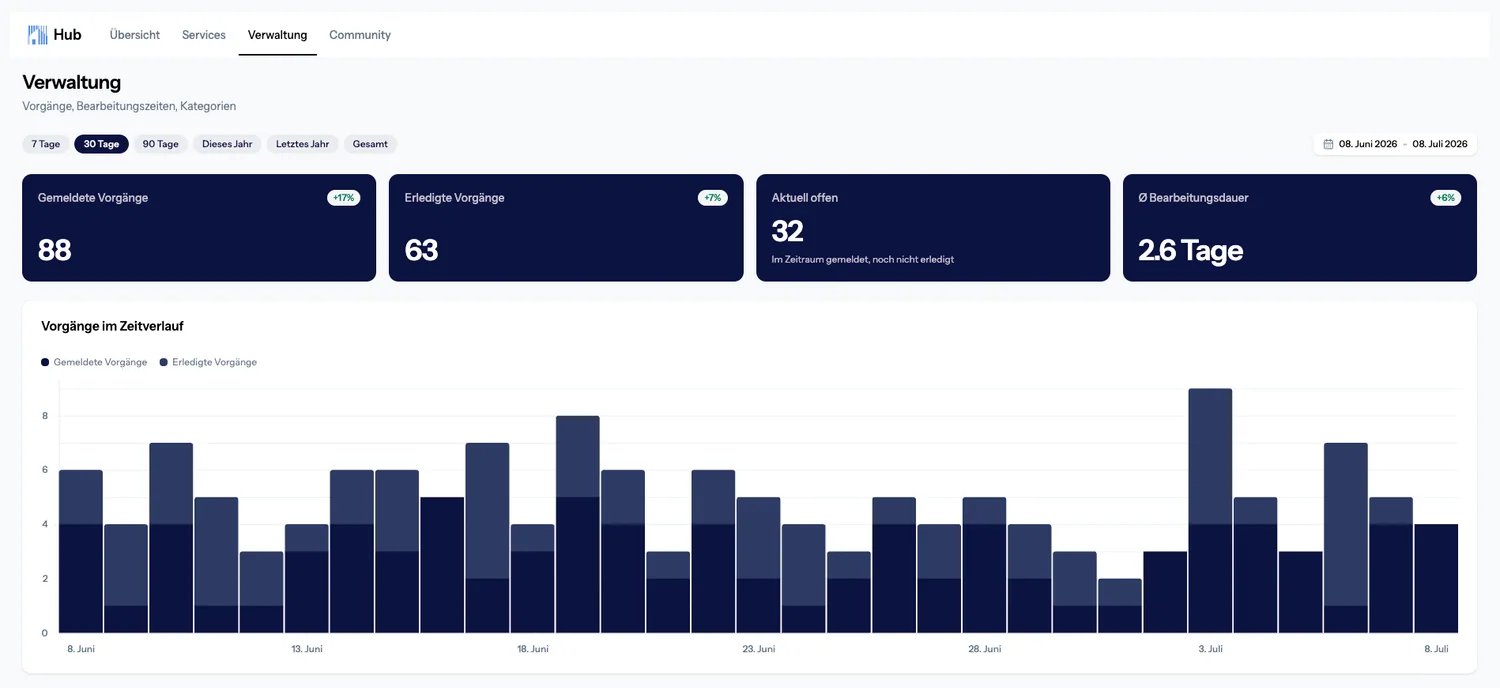
Processing times, success rates and bottlenecks become visible. Neighbourhood Analytics shows where processes stall and makes it tangible where you should act before a signal becomes a problem.
Community
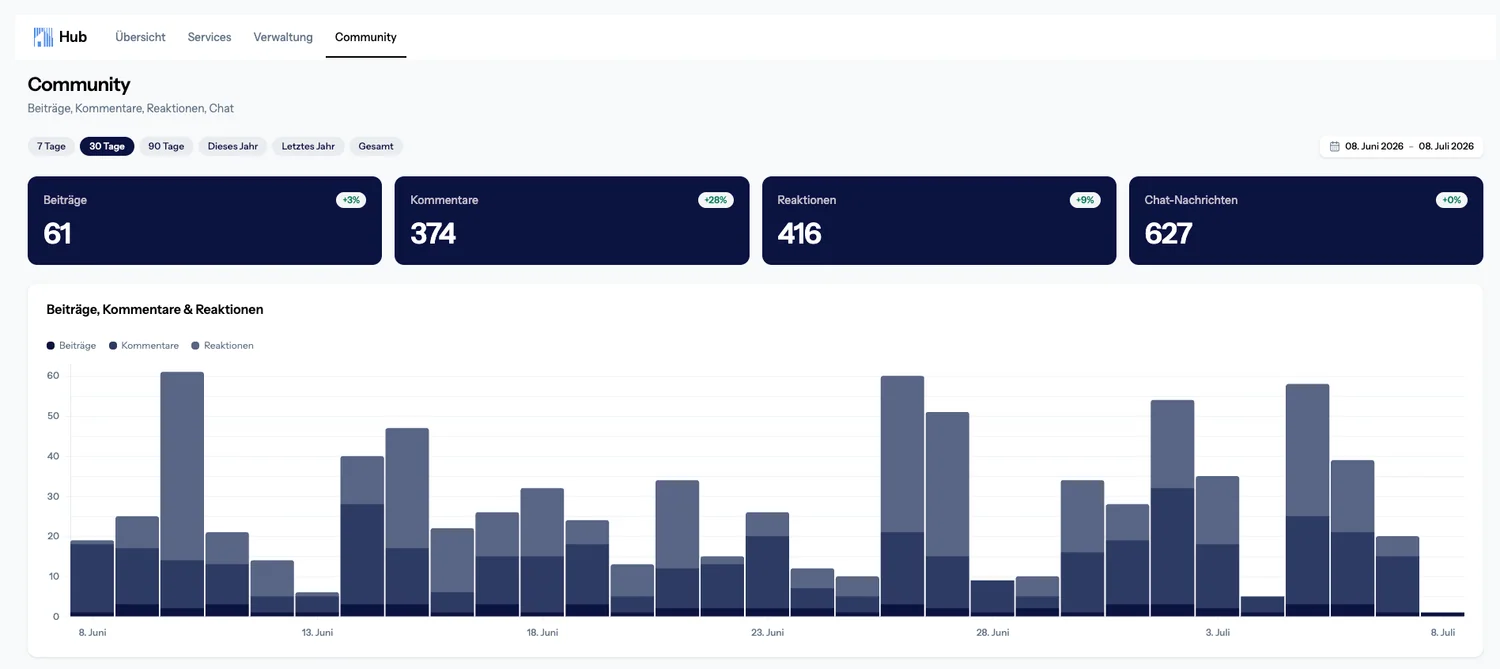
You see which actions move the neighbourhood and which fall flat. Chat activity, event participation and engagement become measurable so you can direct your next move where it has impact.
Services
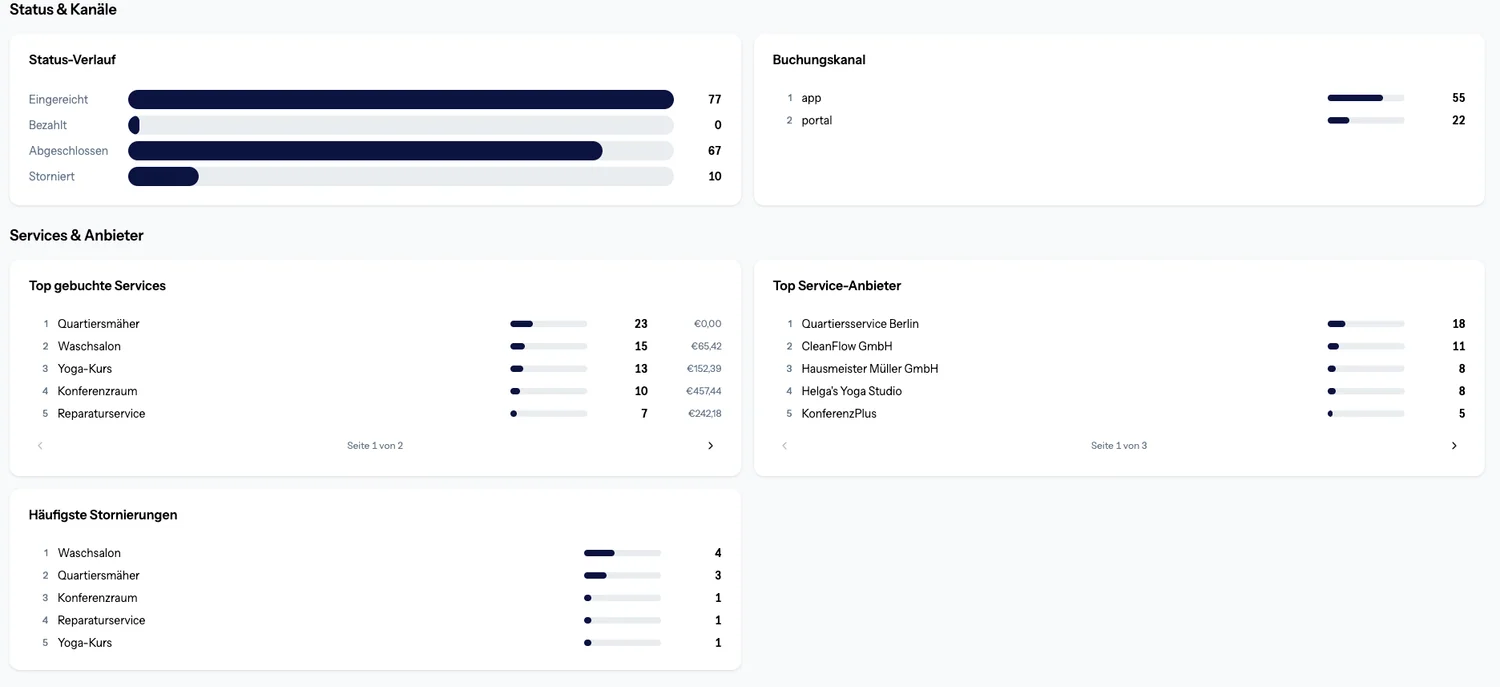
Revenue trends, top services and utilisation at a glance. Neighbourhood Analytics shows which services drive returns and where untapped potential lies, so you can evolve your offering with data.
For your goals
The same data, two clear viewpoints. Neighbourhood Analytics delivers each audience exactly the KPIs that matter for their decisions.
Member retention and social sustainability become measurable. Neighbourhood Analytics shows how active your neighbourhoods are and where engagement strengthens retention, a robust contribution to satisfaction and tenure.
Service revenue, utilisation and operational KPIs support NOI resilience. Reporting on demand provides the data base for ESG, DGNB and value-oriented decisions across the lifecycle.
The ANIMUS operating platform
Four services, one partner: from the first concept to asset management.
From the first concept to the handover into operation, in seven modules.
To Neighbourhood AdvisoryServices, community and management for your residents in one app.
To the Neighbourhood AppAsset management for neighbourhoods, delivered with our partner Quartea Asset Management.
To Asset ManagementLet us show you in a short demo how Neighbourhood Analytics brings transparency and control into your neighbourhood.
